
Dairy Pipe Sizing & Reynolds Number
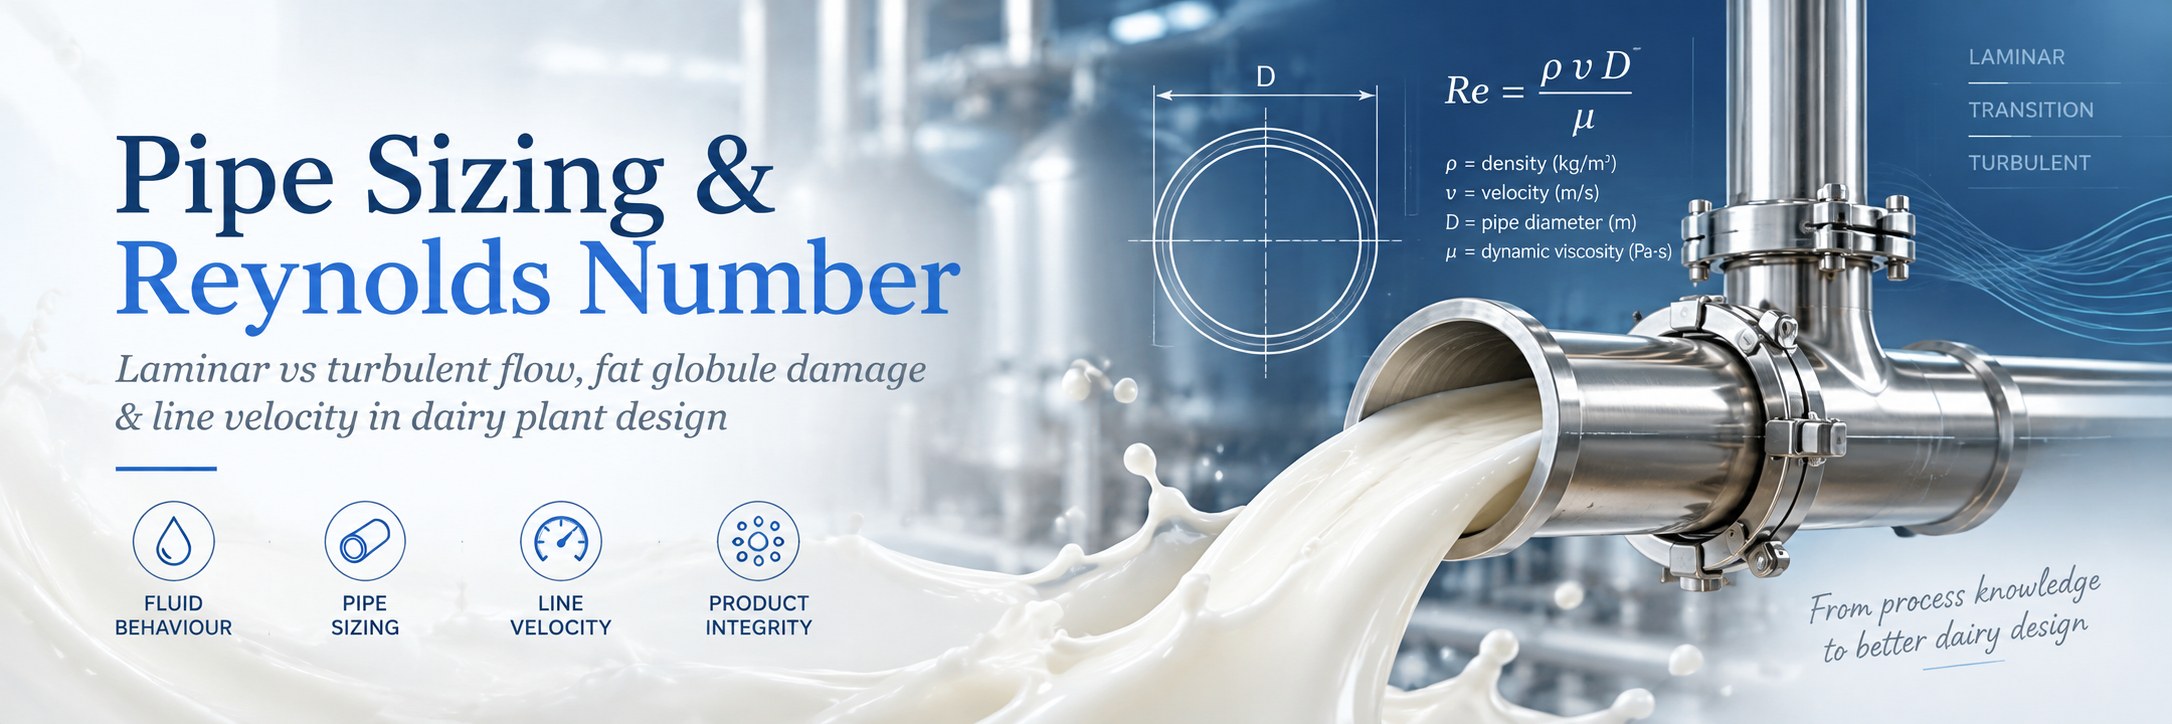
Pipe size is one of the most consequential decisions in dairy process design. Choose too small and shear damages the milk fat globule membrane, generating free fatty acids and rancidity. Choose too large and flow becomes laminar — the pipe wall is not scoured, biofilms form, and CIP fails to clean properly.
This guide covers the Reynolds number, the difference between laminar and turbulent flow, the documented effect of high shear on milk fat globules, recommended velocity ranges from credible sources, and an inline calculator for screening pipe sizes against your duty.
Why Pipe Sizing Matters in Dairy
In a continuous dairy plant, every litre of product passes through pipework. The pipe diameter chosen at design stage sets two outcomes that cannot be undone without recapitalising the asset:
- Hygienic performance — whether the pipe can be cleaned in place reliably, or whether biofilms develop that progressively shorten product shelf life and create food safety risk
- Product quality — whether the product sees acceptable shear, or whether the velocity in pipes and through fittings damages fat globules, releases free fatty acids, generates rancidity, and reduces yield in downstream separation
Both outcomes are governed by the Reynolds number, a dimensionless quantity that describes whether the flow regime is smooth (laminar) or chaotic (turbulent). Getting the calculation right is one of the simplest interventions in dairy plant design with the highest long-term operational consequences.
The Reynolds Number Explained
The Reynolds number, named after Osborne Reynolds (whose 1883 experiments at the University of Manchester first characterised the laminar-turbulent transition), is the ratio of inertial forces to viscous forces in a flowing fluid. It is calculated as:
The Reynolds number is dimensionless — the units cancel out — which means it can be used to compare flow conditions across vastly different fluids, pipe sizes and applications. For practical purposes in dairy:
| Reynolds Number | Flow Regime | Behaviour |
|---|---|---|
| Re < 2,300 | Laminar | Smooth, layered flow. Fluid in the centre moves fastest; layers near the wall barely move. Pipe wall is not mechanically scoured during CIP. Biofilms can develop. |
| 2,300 ≤ Re ≤ 4,000 | Transitional | Unstable, intermittent turbulence. Process design avoids this band — behaviour is unpredictable. |
| Re > 4,000 | Turbulent | Chaotic eddies, velocity profile flattened, the boundary layer at the wall is regularly disrupted. Required for CIP to work. Required for most dairy product flow. |
Why You Need Turbulent Flow — And Why Too Much Is a Problem
The case for turbulence
Turbulent flow is required in dairy pipework for one overriding reason: cleaning. CIP relies on mechanical action at the pipe wall to dislodge soil — protein, fat and mineral deposits left after each production run. Without turbulence, CIP becomes a chemical soak rather than a scour, and soil remains attached to the surface. EHEDG and 3-A guidelines accordingly require that CIP flow rates be high enough to produce turbulent flow throughout the pipework, with wall shear stress typically above 3 Pa or wall shear rate above 500 s⁻¹ for biofilm removal in dairy applications.[1][2]
The case against excessive velocity
However, turbulence is also a destructive force at high velocities. The same eddies that scour the pipe wall also impact the milk fat globule membrane (MFGM), the thin biological membrane that surrounds each fat droplet and keeps the emulsion stable. Damage to the MFGM has been documented extensively in the dairy science literature:
- Mechanical pumping damage: Centrifugal pumps and high-velocity pipework physically disrupt the fat globule membrane, releasing lipases that hydrolyse milk fat into free fatty acids (FFA). The result is rancid off-flavours — sometimes detectable in finished product, sometimes only after storage or in derivative products like butter and milk powder.[3][4]
- Shear-induced lipolysis: Even without homogenisation pressures, ordinary pipework shear can be sufficient to damage the MFGM and trigger lipolysis. The effect is cumulative — raw milk that has been pumped through unsuitable equipment is irreversibly compromised before it even reaches the pasteuriser.[5]
- Quantified MFGM dissociation: A 2018 study in the Journal of Membrane Science measured 20-24% dissociation of polar lipids from the MFGM under shear conditions typical of microfiltration and centrifugal separation — demonstrating that even routine process operations can substantially alter milk fat colloidal properties.[6]
- Free fatty acid release: Once the MFGM is damaged, lipoprotein lipase (native to raw milk) has access to triglycerides within the globule and rapidly hydrolyses them. The released free fatty acids cause hydrolytic rancidity — a soapy, goaty off-flavour that is a common quality failure mode in milk powder and infant formula.[7]
This is often traceable to pipework velocity, pump selection or transfer practice rather than to raw milk quality. An independent process review can identify the source quickly. Schedule a call with Watson Dairy Consulting →
Recommended Velocity Ranges for Dairy Pipework
The dairy industry has converged on a practical operating envelope that balances the two competing requirements — enough velocity for turbulence and CIP, not so much that fat globules are damaged. The widely cited range across published hygienic design guidance is 1 to 3 m/s for product transfer, with the lower end favoured for cold, fat-rich products and the higher end acceptable for water-like fluids and CIP solutions.[1][2][8]
| Application | Target Velocity | Notes & Source |
|---|---|---|
| Raw milk transfer (farm tanker, milk reception) | 1.0–1.5 m/s | Lower velocity protects fat globules; centrifugal pumps already shear-heavy[1][3] |
| Whole milk processing (pasteurisation, separation feed) | 1.5–2.5 m/s | Balanced for hygiene and fat globule integrity[8] |
| Skim milk, water-like fluids | 1.5–3.0 m/s | Higher velocity tolerated — no fat to protect[2] |
| Cream (40&%+ fat) | 0.8–1.5 m/s | Higher viscosity, more shear-sensitive — lower velocity essential[3] |
| Yoghurt mix, fermented products | 0.5–1.5 m/s | Texture-sensitive; gentle handling, positive displacement pumps preferred |
| CIP solutions (caustic, acid) | 1.5–3.0 m/s | Higher velocity to ensure wall shear stress > 3 Pa for biofilm removal[1][2] |
| Concentrate (evaporator outlet, 40&%+ TS) | 0.5–1.5 m/s | High viscosity; Reynolds number harder to achieve, pipe sizing critical |
These are working ranges, not absolutes. The full design calculation requires knowledge of the specific product viscosity at operating temperature, the actual pipe internal diameter (ISO 2037, DIN 11850, or 3-A standards differ), pressure drop along the full circuit, and the equipment served by the pipework. The calculator below screens against the velocity ranges; the final design decision needs to account for the rest.
Milk, raw milk and cream are three different design cases
The velocity table above is often read as “milk must be kept slow and laminar”. It must not. The three cases are different in mechanism and in what the calculator should show:
| Stream | Shear concern | Product flow regime | Design intent |
|---|---|---|---|
| Pasteurised milk (whole or skim, 1–3 cP) | Minimal — lipoprotein lipase is inactivated by pasteurisation, so MFGM damage no longer drives rancidity | Fully turbulent at any practical velocity | Size for 1.5–3 m/s, overlapping the CIP envelope, so the CIP flow is often close to the product flow. There is no case for laminar milk flow. |
| Raw milk (reception, silos, feed to pasteuriser) | Lipolysis — native lipase is still active, so MFGM damage from centrifugal pumps, air incorporation and foaming releases free fatty acids[5] | Still turbulent: at 1 m/s in a 3″ line whole milk at 4 °C is Re ≈ 28,000 | Hold velocity to 1–1.5 m/s, prefer PD pumps, avoid air. The velocity limit is about shear at pumps and fittings, not about avoiding turbulence. |
| Cream (18–40%+ fat, especially cold) | Partial coalescence and churning — cold cream carries crystalline fat, so shear destabilises the emulsion rather than just triggering lipolysis[3][4] | Often transitional or laminar at design velocity because viscosity is 10–100× that of milk | 0.8–1.5 m/s with PD pumps. Laminar product flow is accepted; the circuit is then cleaned at roughly twice the product velocity (about 2 m/s), which means a CIP flow of 1.5–2× the product flow. |
The same logic applies to concentrate, ice cream mix and cultured products: the product may legitimately run laminar, but the CIP for that circuit must not. In practice this means the CIP supply pump is sized for a higher flow than the product pump on the same line.
Why CIP needs more flow than the product
Two things fix the CIP flow, and neither of them is the Reynolds number. A hot caustic or acid solution is water-like (about 0.4–0.5 cP at 75 °C), so it passes the Re > 4,000 test at almost any flow — in a 3″ line it is nominally “turbulent” at about 0.06 m/s. Turbulence at that velocity cleans nothing. What removes soil is wall shear stress. Timperley’s 1981 pipe-cleaning trials showed that soil removal correlated with mean velocity rather than Reynolds number, because wall shear stress and the thickness of the laminar sub-layer both scale with velocity, and later work established that a minimum critical wall shear stress must be reached before any cleaning effect is detectable; for the standardised EHEDG cleanability test that critical value was determined as about 3 Pa.[14][15][16]
Where the 1.5 m/s figure comes from, and why it is a floor
The 1.5 m/s (5 ft/s) figure that appears in most guidance originates in 3-A Accepted Practice 605 and the EHEDG guidelines, and it is stated there as a minimum. 3-A 605-04 tabulates the flows needed to reach 5 ft/s in each tube size and then adds that these rates are usually adequate for pipelines handling milk and other relatively low-fat products, but that for more viscous products such as cream, ice cream mix or concentrated milk it may be necessary to change these velocities.[17] The academic literature is blunter: Lelièvre and co-workers note that 1.5 m/s is the velocity most often reported in industry CIP but that it is anecdotal, with no theoretical justification.[18] Equipment suppliers quote the same 1.5 m/s minimum,[9][10][11] and a supplier sizing a CIP set to the minimum is sizing it as economically as the guidance allows.
The wall shear stress numbers show why practitioners design above the floor. For a hot caustic solution in straight hygienic tube, the bulk wall shear stress works out at roughly:
| Velocity | 1½″ (37 mm) | 2″ (50 mm) | 3″ (81 mm) | 4″ (100 mm) | Against 3 Pa critical |
|---|---|---|---|---|---|
| 1.0 m/s | 2.2 Pa | 2.1 Pa | 1.9 Pa | 1.8 Pa | Below — does not clean |
| 1.5 m/s | 4.6 Pa | 4.3 Pa | 3.9 Pa | 3.8 Pa | Marginal — 30–50% above, in straight pipe only |
| 2.0 m/s | 7.7 Pa | 7.3 Pa | 6.6 Pa | 6.4 Pa | About 2× — margin for fittings and dead legs |
| 2.5 m/s | 11.5 Pa | 10.9 Pa | 10.0 Pa | 9.6 Pa | >3× |
| 3.0 m/s | 16.1 Pa | 15.2 Pa | 13.9 Pa | 13.4 Pa | >4× |
τ = (f/8)·ρ·v² with the Haaland friction factor, water at 75 °C (ρ = 975 kg/m³, ν = 0.39 × 10⁻⁶ m²/s), Ra 0.8 μm surface. The 3 Pa critical value was derived for the EHEDG radial flow cell test and transfers to pipework only approximately; later work shows shear stress fluctuation matters as well as its mean.[16][19] Treat the table as an order-of-magnitude comparison, not a design limit.
At 1.5 m/s the bulk wall shear in a 3″ or 4″ line is under 4 Pa — barely above the critical value, and that is the average in straight pipe. Downstream of an expansion, in the leg of a tee, behind a butterfly disc or at a dead leg the local shear is a fraction of the bulk figure, which is where cleaning validations actually fail. At 2 m/s the bulk shear roughly doubles, providing margin in those zones; this is why CIP designers commonly target 7 ft/s (about 2.1 m/s), particularly in 3″ and larger lines, to overcome entrained air and dead-leg areas.[12] Above about 4 m/s the laminar sub-layer reaches an asymptotic minimum and further increases give little benefit, so there is no case for going far beyond 3 m/s either.[19] The practical design envelope is therefore 1.5–3 m/s with about 2 m/s as the target, which is what Tetra Pak’s handbook also states for the detergent feed pumps.[9]
Set that against the product side. Raw milk and cream lines are sized at about 1 m/s and pasteurised milk at 1.5–2 m/s, and the pipe diameter is then fixed. Velocity is flow divided by cross-sectional area, so the only way to raise the CIP velocity in that pipe is to raise the flow. In practice this gives the rule of thumb that CIP runs at roughly twice the product velocity, which is the same thing as saying the CIP flow is roughly 1.5–2 times the production flow — the multiplier quoted for cleaning heat exchangers and process lines.[13] A cream line at 1 m/s needs 2× the product flow to reach 2 m/s; a raw milk line at 1.2 m/s needs about 1.7×; a pasteurised milk line already running at 2 m/s may need no increase at all, which is why milk circuits are the easy case and cream, concentrate and cultured-product circuits are where CIP pumps end up undersized.
| Pipe | ID (mm) | Product flow at 1.0 m/s | CIP minimum, 1.5 m/s | CIP design target, 2.0 m/s |
|---|---|---|---|---|
| 1½″ | 37 | 3,900 L/h | 5,800 L/h | 7,700 L/h |
| 2″ | 50 | 7,100 L/h | 10,600 L/h | 14,100 L/h |
| 2½″ | 66 | 12,300 L/h | 18,500 L/h | 24,600 L/h |
| 3″ | 81 | 18,500 L/h | 27,800 L/h | 37,100 L/h |
| 4″ | 100 | 28,300 L/h | 42,400 L/h | 56,500 L/h |
Flows computed from velocity × πd²/4 for the ISO 2037 internal diameters used in the calculator. Tetra Pak’s published table for 1.5 m/s (2,070 L/h at 25 mm through 40,200 L/h at 101.6 mm) uses slightly different nominal bores and agrees to within rounding.[10]
Three practical consequences follow. The CIP flow for a circuit is governed by its largest diameter, not the product pipe you happen to be looking at — a 2″ product line that runs through a 3″ header or a large valve manifold needs the 3″ CIP flow, and because area rises with the square of diameter, going from 2″ to 4″ needs four times the flow.[12] Circuits with parallel paths (manifolds, multiple tank outlets, split routes) need the flow in each path checked, because the CIP solution takes the path of least resistance. And the product pump is usually the wrong CIP pump: a PD pump on a cream line delivering 18,500 L/h through 3″ cannot supply the 37,000 L/h needed for 2 m/s, so either a dedicated CIP supply pump or a bypass around the product pump is required.
This is why positive displacement pumps are installed with a CIP bypass. A PD pump delivers a fixed volume per revolution, so its flow is set by speed and sized to the product duty — 1 m/s in the line for cream or raw milk. Left in circuit during CIP it would cap the flow at the product rate, giving roughly half the velocity and a quarter of the wall shear that the circuit needs, and its rotor clearances and internal passages restrict the CIP set’s flow even if the drive is run up. Pump manufacturers therefore specify that the drive must have enough speed range and power to pass CIP solution at the required velocity, and that if the pump cannot supply enough CIP velocity a separate CIP supply pump with an installed bypass around the PD pump must be used.[20] The bypass carries the full CIP flow past the pump while the pump itself is turned slowly to clean its own rotor case and seals. The same logic explains why a raw-milk PD reception pump, a cream PD transfer pump and a concentrate PD feed pump each need a bypass, and why a pasteurised-milk centrifugal pump usually does not: centrifugal pumps pass whatever flow the CIP supply pump pushes through them, and milk lines are already sized close to CIP velocity. The calculator table below shows the CIP flow needed for both the 1.5 m/s minimum and the 2.0 m/s design target in every pipe size, so this can be checked against the CIP set capacity at the same time as the pipe is chosen.
Interactive Reynolds Number Calculator
The calculator below replicates the Watson Dairy Consulting pipe sizing spreadsheet. Enter the flow rate, viscosity and density, and the table compares line velocity, Reynolds number and flow regime across standard pipe sizes. The system highlights the pipe that is closest to your target velocity range while staying in turbulent flow.
Pipe Velocity & Reynolds Number Calculator
Enter product flow and viscosity to compare line velocity, Reynolds number and flow regime across common process pipe sizes.
Pipe size comparison
| Pipe | ID (mm) | Velocity (m/s) | Re | Regime | CIP min 1.5 m/s (L/h) | CIP design 2.0 m/s (L/h) |
|---|
Formula basis: flow is converted internally to L/h; area = πd²/4; velocity = flow ÷ area ÷ 3.6; Reynolds number = density × velocity × diameter ÷ dynamic viscosity. Laminar < 2,300; transitional 2,300–4,000; turbulent > 4,000. CIP flows use a 1.5 m/s minimum and a 2.0 m/s design target, with a water-like caustic or acid solution at about 75 °C (0.45 cP, 1,000 kg/m³) for the CIP Reynolds number.[9][10][11][12] Preliminary screening only — check against actual pipe standard, product properties, hygienic design constraints and pressure-drop requirements before final design.
Understanding the Viscosity Input
Viscosity is the fluid's resistance to flow. The calculator takes it in centipoise (cP), which is numerically identical to millipascal-seconds (mPa·s); water at 20 °C is 1 cP. Internally the value is divided by 1,000 to give the dynamic viscosity in Pa·s that the Reynolds formula requires, so 3 cP is used as 0.003 Pa·s.
Reynolds number is inversely proportional to viscosity: double the viscosity and Re halves. Density, by contrast, varies only from about 1,000 to 1,040 kg/m³ across most dairy liquids and has little effect on the result. That is why milk at 3 cP is turbulent in every standard pipe size at typical plant flows, while cream or evaporator concentrate at 20–200 cP drops into transitional or laminar flow in the same pipework. If every row of the table reads “Turbulent”, the calculation is not wrong — for a low-viscosity product at production flow rates that is the expected answer.
| Product | Temperature | Typical viscosity (cP) | Typical density (kg/m³) |
|---|---|---|---|
| Water | 20 °C | 1.0 | 998 |
| Whole milk | 4 °C | ~3 | 1,030 |
| Whole milk | 20 °C | ~2 | 1,030 |
| Whole milk | 40 °C | ~1.2 | 1,025 |
| Skim milk | 4 °C | ~2.5 | 1,036 |
| Single cream (18% fat) | 5 °C | ~10–15 | 1,010 |
| Double cream (40%+ fat) | 5 °C | ~50–100+ | 995 |
| Milk concentrate (45–50% TS) | 50 °C | 50–500+, rising steeply with solids | 1,150–1,200 |
| Ice cream mix | 5 °C | ~100–300 (apparent) | 1,100 |
| Stirred yogurt | 5–20 °C | 100–1,000+ (apparent, shear-thinning) | 1,040 |
| CIP caustic (1.5%) | 75 °C | ~0.45 | 1,000 |
Values are typical engineering figures at the stated temperature, drawn from the Tetra Pak Dairy Processing Handbook and Walstra et al.[3][4] Cream, concentrate and cultured products vary widely with fat content, solids, temperature history and shear rate — use measured data for final design.
Two things to get right
- Use the viscosity at the temperature in the pipe. Viscosity falls sharply with temperature: whole milk is roughly 3 cP at 4 °C, 2 cP at 20 °C and about 1.2 cP at 40 °C. A cold raw-milk line and a pasteuriser outlet line carrying the same product at the same flow have Reynolds numbers differing by a factor of two or more.
- Treat shear-thinning products as screening only. Yogurt, high-fat cream, ice cream mix and concentrates are non-Newtonian: their effective viscosity depends on the shear rate in the pipe, so a single cP figure is an approximation. Enter the apparent viscosity at roughly the wall shear rate you expect (higher velocity → lower apparent viscosity) and confirm with rheometer data or a pumping trial before committing to a pipe size.
Practical Considerations Beyond Velocity
Dead Legs
Branches and tees with stagnant volumes are not cleaned by the main flow. EHEDG guidance limits dead leg length to ≤2 pipe diameters (L/D ≤ 2). Particularly critical for valves, sample ports and instrument tappings.
Pump Selection
Centrifugal pumps shear product more than positive displacement pumps. For raw milk and shear-sensitive products (cream, fermented products) use rotary lobe, progressive cavity or diaphragm pumps in preference where duty allows. Fit every PD pump with a CIP bypass: its fixed displacement caps the circuit at product flow, which is roughly half the CIP velocity and a quarter of the wall shear the line needs to clean.[20]
Fittings & Bends
Tight bends, sudden contractions and inline fittings create local high-shear zones. The velocity rule applies to mean velocity in the straight run; fitting selection determines local shear extremes.
Surface Finish
EHEDG and 3-A both specify Ra ≤ 0.8 μm for product contact surfaces. Smoother walls reduce biofilm anchorage points and increase CIP effectiveness at any given velocity.
Temperature Effects
Viscosity changes substantially with temperature. Milk at 4°C is roughly twice as viscous as at 40°C. Reynolds number drops as fluid cools, sometimes pushing flow into the transitional zone unexpectedly.
Pressure Drop
Higher velocity gives higher pressure drop (typically v² scaling in turbulent flow). Pumping cost, NPSH availability and pump head all factor into the final pipe size decision alongside the velocity calculation.
Frequently Asked Questions
What is the maximum velocity for milk in a pipe?
Most credible dairy engineering guidance places the practical upper limit at around 3 m/s for milk and water-like dairy fluids, with raw milk and cream typically held below 2 m/s to protect the milk fat globule membrane from shear damage. The lower end of the range (1.0–1.5 m/s) is preferred for high-fat or shear-sensitive products. Above 3 m/s, fat globule damage, free fatty acid release and rancidity become measurable risks.[1][2][3][8]
Why do we need turbulent flow if it damages fat?
Because the alternative is worse. Laminar flow allows biofilms to develop on the pipe wall — bacteria attach, reproduce, and create a layer that CIP cannot remove. Biofilms then become a permanent source of post-pasteurisation contamination, ruining product shelf life and creating food safety risk. Turbulent flow at the right velocity scours the wall mechanically and prevents biofilm establishment. The dairy industry has settled on 1–3 m/s as the working envelope that delivers turbulence without excessive shear.
What happens when flow is laminar in dairy pipework?
Two things go wrong. First, the boundary layer near the wall stays effectively stagnant — soil deposits accumulate during production and are not removed during CIP, so cleaning becomes a chemical soak rather than a mechanical scrub. Second, microbial biofilms develop, become structurally stable, and start shedding bacteria into product. Shelf life shortens, plate counts rise, and the root cause is often missed because the pipework "looks clean" visually.
How does damaged fat globule membrane affect milk quality?
The milk fat globule membrane (MFGM) is a biological membrane derived from the mammary gland that surrounds each fat droplet and keeps the emulsion stable. When damaged by excessive shear, native lipoprotein lipase enzymes gain access to the triglycerides inside the globule and rapidly hydrolyse them into free fatty acids. Free fatty acids cause hydrolytic rancidity — a soapy, goaty, sometimes vomit-like off-flavour. This is a common quality defect in milk powder and infant formula, often traceable to pipework or pump shear rather than to raw milk quality.[3][7]
Does the Reynolds number depend on temperature?
Yes, indirectly — through viscosity. Milk at 4°C has dynamic viscosity around 3 cP; at 40°C it drops to around 1.5 cP. Since Reynolds number is inversely proportional to viscosity, the same flow rate at a higher temperature gives a higher Reynolds number. A pipe sized for warm processing may move into the transitional zone when running cold milk. The calculator above lets you change the viscosity input to test this.
How is dairy pipe sizing different from water pipe sizing?
Three differences. First, dairy fluids vary in viscosity from water-like (skim) to honey-like (concentrate) over the same plant. Second, the hygienic requirement — turbulent flow throughout, no dead legs, full drainability — sets minimum velocities that water systems do not need. Third, the product is shear-sensitive in a way that water is not. Standard industrial pipe sizing rules of thumb (typically optimised for pressure drop and cost) do not transfer directly to dairy and routinely produce undersized or oversized lines.
What pipe standard should I use?
Sanitary dairy pipework typically uses ISO 2037, DIN 11850, or 3-A standards. ISO 2037 and DIN 11850 are common in Europe; 3-A is the US sanitary standard. Pipe internal diameters differ slightly between standards even for the same nominal size, so the Reynolds calculation should use the actual internal diameter of the chosen pipe rather than the nominal. Surface finish requirement (Ra ≤ 0.8 μm for product contact) is consistent across all major hygienic standards.[1][2]
Related calculator: Evaporator Steam Economy Calculator — compare multi-effect, TVR and MVR energy use and running cost for milk powder plants.
References
- EHEDG (European Hygienic Engineering & Design Group). Hygienic Design of Closed Equipment for the Processing of Liquid Food, EHEDG Doc 10. EHEDG Guidelines cover the design and selection of hygienic process pipework, surface finish requirements, and CIP flow conditions. Available via www.ehedg.org.
- 3-A Sanitary Standards, Inc. 3-A Sanitary Standards for Stainless Steel Automotive Milk Transportation Tanks for Bulk Delivery and/or Farm Pick-up Service and related standards for hygienic piping. Establishes minimum surface finish (Ra ≤ 0.8 μm), material specifications and design requirements for dairy contact surfaces. www.3-a.org.
- Bylund, G. (2015). Dairy Processing Handbook, 3rd edition. Tetra Pak Processing Systems AB. The standard practical reference for dairy process engineering, including detailed treatment of milk fat globule structure, pump selection and pipework design. ISBN 978-91-631-3427-2.
- Walstra, P., Wouters, J. T. M., & Geurts, T. J. (2006). Dairy Science and Technology, 2nd edition. CRC Press / Taylor & Francis. Authoritative academic text covering milk fat globule biology, MFGM damage mechanisms, and lipolysis kinetics. ISBN 978-0-8247-2763-5.
- Deeth, H. C. (2006). Lipoprotein lipase and lipolysis in milk. International Dairy Journal, 16(6), 555-562. Comprehensive review of shear-induced lipolysis in raw milk and the role of pipework, pumps and agitation in MFGM damage.
- Hansen, S. F., Petrat-Melin, B., Rasmussen, J. T., Larsen, L. B., Ostenfeld, M. S., & Wiking, L. (2018). Production of native bovine milk fat globules under simulated shear conditions of processing. Journal of Membrane Science, 568, 92-100. Documents 20-24% polar lipid dissociation from MFGM under shear conditions typical of microfiltration and centrifugal separation.
- Cano-Ruiz, M. E., & Richter, R. L. (1997). Effect of homogenization pressure on the milk fat globule membrane proteins. Journal of Dairy Science, 80(11), 2732-2739. Quantifies MFGM protein release and free fatty acid generation under controlled shear conditions.
- Pharma Machines & Technology (2025). Hygienic Design Vessels and Pipes. Industry technical reference confirming the 1-3 m/s velocity envelope for hygienic pipework and the wall shear stress threshold (>3 Pa) required for biofilm removal. pharmamachines.com.
- Tetra Pak. Dairy Processing Handbook, Chapter 21: Cleaning of Dairy Equipment. States that detergent feed pumps are dimensioned for higher capacities than the product pumps, with flow velocities of 1.5–3.0 m/s in the pipes. dairyprocessinghandbook.tetrapak.com/chapter/cleaning-dairy-equipment
- Tetra Pak. Cleaning in Place: A Guide to Cleaning Technology in the Food Processing Industry. Gives 1.5 m/s as the minimum CIP velocity for adequate mechanical force and tabulates the volume flows needed to achieve it in 1″–4″ pipe. PDF
- Alfa Laval. Brewery CIP webinar Q&A (2020): a minimum velocity of 1.5 m/s is recommended for CIP in pipes to reach the required turbulent flow and wall shear stress. alfalaval.com
- Central States Industrial (CSI). Understanding Clean-in-Place Supply Pumps. 5 ft/s (1.5 m/s) as the absolute minimum, 5–7 ft/s the accepted target range, with 7 ft/s (about 2 m/s) preferred in 3″ and larger lines. csidesigns.com
- Food Processing (2009). MRO Q&A: How Do You Calculate CIP Parameters? Pipe CIP velocity above 5 ft/s; CIP flow through tubular heat exchangers commonly 1.5–2 times the production flow. foodprocessing.com
- Timperley, D. A. (1981). The effect of Reynolds number and mean velocity of flow on the cleaning-in-place of pipelines. In: Hallström, B., Lund, D. B. & Trägårdh, C. (eds), Fundamentals and Applications of Surface Phenomena Associated with Fouling and Cleaning in Food Processing, Lund University, pp. 402–412. Showed that soil removal in pipes correlates with mean velocity, not Reynolds number.
- Jensen, B. B. B. (2003). Hygienic Design of Closed Processing Equipment by Use of Computational Fluid Dynamics. PhD thesis, Technical University of Denmark. Established that a minimum critical wall shear stress must be reached before a detectable cleaning effect occurs.
- Jensen, B. B. B. & Friis, A. (2004). Critical wall shear stress for the EHEDG test method. Chemical Engineering and Processing, 43(7), 831–840. Derived a critical wall shear stress of about 3 Pa for the standardised EHEDG cleanability test. doi:10.1016/j.cep.2003.09.001
- 3-A Sanitary Standards, Inc. (1994). 3-A Accepted Practices for Permanently Installed Product and Solution Pipelines and Cleaning Systems Used in Milk and Milk Product Processing Plants, Number 605-04, Appendix K, Flow Rates. Specifies a minimum of 5 ft/s (1.5 m/s), tabulates the flows per tube size, and notes that higher velocities may be necessary for cream, ice cream mix and concentrated milk products. Superseded by 605-05 (2021), which retains the 5 ft/s minimum. PDF (Virginia regulatory archive)
- Lelièvre, C., Legentilhomme, P., Gaucher, C., Legrand, J., Faille, C. & Bénézech, T. (2002). Cleaning in place: effect of local wall shear stress variation on bacterial removal from stainless steel pipes. Chemical Engineering Science, 57(8), 1287–1297; and Bénézech, T. et al. (2002). A new test method for in-place cleanability of food processing equipment. Journal of Food Engineering, 54(1), 7–15. Note that the industry 1.5 m/s figure is anecdotal with no theoretical justification, and that local wall shear downstream of fittings governs removal.
- Augustin, W., Fuchs, T., Föste, H., Schöler, M., Majschak, J.-P. & Scholl, S. (2010). Pulsed flow for enhanced cleaning in food processing. Food and Bioproducts Processing, 88(4), 384–391. Reviews Timperley (1981), Jensen (2003) and Hoffmann (1983), the last reporting that the laminar sub-layer reaches an asymptotic minimum above about 4 m/s so further velocity increases give little benefit. doi:10.1016/j.fbp.2010.08.005
- Dixon Sanitary. JRZL Series Rotary Lobe Pump — CIP Instructions. Specifies that the CIP solution velocity must be adequate for the entire circuit (5 ft/s for most applications), that the pump drive must have sufficient speed range and power to pass it, and that where the pump cannot supply enough CIP velocity a separate CIP supply pump with an installed bypass is to be used. dixonvalve.com
- Reynolds, O. (1883). An experimental investigation of the circumstances which determine whether the motion of water shall be direct or sinuous, and of the law of resistance in parallel channels. Philosophical Transactions of the Royal Society, 174, 935-982. The original characterisation of laminar-turbulent transition that underpins all subsequent pipe flow analysis.
Further reading: John Watson publishes articles on dairy industry topics on LinkedIn — from infant formula safety and milk supply to plant design, yield improvement and dairy commodity outlook. Browse all articles by John Watson on LinkedIn →
See our related dairy factory design, process optimisation, CIP training, membrane filtration, milk separator, factory benchmarking and equipment selection pages, or browse all consultancy services.
John Watson
Office: +44 1224 861 507
Mobile: +44 7931 776 499
jw@dairyconsultant.co.uk
We are a longstanding member of the Society of Dairy Technology
and have Fellowship of the Institute of Food Science and Technology.



Contact Details
John Watson
Office: +44 1224 861 507
Mobile: +44 7931 776 499
jw@dairyconsultant.co.uk
What Our Clients Say
We are a longstanding member of the Society of Dairy Technology
and have Fellowship of the Institute of Food Science and Technology.
Locations

Services
Enquiry Form

